JustTicks Adds BTC, ETH and XAUT Options Analytics and Gamma Exposure Tools
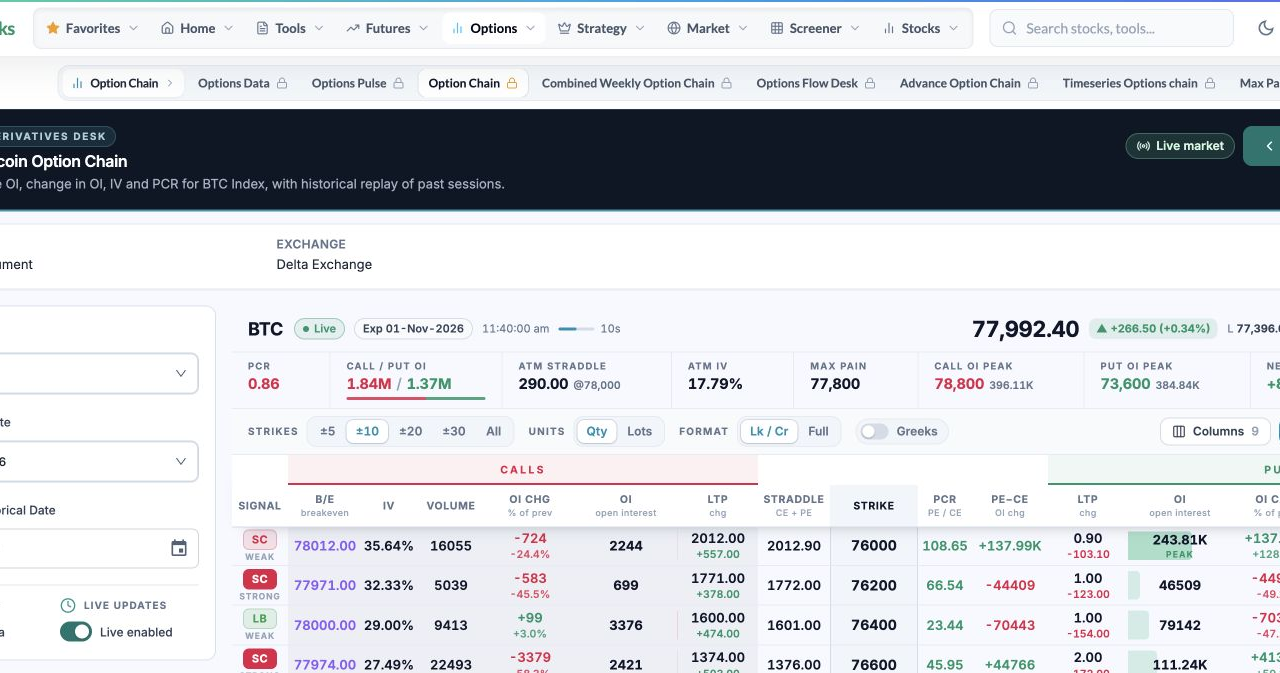
GURGAON, India — November 1, 2026 — JustTicks has announced options analytics tools for Bitcoin (BTC), Ether (ETH) and Tether Gold (XAUT), extending its web-based research platform for Indian traders. The three instrument-specific option-chain pages identify Delta Exchange as the venue and provide an expiry-based view of call and put contracts. The launch adds crypto options to the platform’s research tools.
The new pages display option premiums, open interest, changes in open interest, traded volume and implied volatility by strike. Summary fields include put-call ratio, at-the-money straddle and max pain. Users can select the underlying instrument and expiry, inspect the available chain and use historical-session controls. Live and historical feature access depends on the user’s account plan and the availability of observations from the source.
Three instrument-specific entry points
The BTC page provides an entry point for Bitcoin options research, while the ETH page covers Ether options. The XAUT page is labelled Tether Gold on the platform. Each opens the chain for its own underlying rather than presenting the three assets as a single combined market. This matters when interpreting contract-level information: the selected underlying and expiry determine which call and put observations belong in the comparison.
A user moving between instruments should therefore check the selected contract before comparing the displayed figures. The interface includes quantity and lot settings, along with number-format controls. Different contract sizes mean that a raw open-interest total for one asset cannot automatically be treated as equivalent to the same number for another. Researchers need to establish a consistent measurement basis before drawing conclusions from cross-asset comparisons.
From a chain overview to a specific research question
The option-chain pages connect to related instrument-specific views through their navigation. These include advanced option-chain, timeseries, open-interest and put-call-ratio analysis. The chain supplies a starting overview, while the linked views provide routes to examine a narrower question, such as how available observations changed over a session or how the call and put sides compare for a selected expiry.
Historical controls make the observation date and mode part of that workflow. A displayed historical snapshot represents the selected observation rather than a current market quote. Before comparing two screens, the researcher should check that the instrument, expiry, timestamp and measurement units match. The platform presents these controls so that users can inspect the context of the information they are viewing, alongside the numerical fields themselves.
Reading the inputs behind summary indicators
The launch retains a distinction between outstanding positions and trading activity. Open interest describes outstanding contracts, while volume measures contracts traded over an interval. A ratio calculated from open interest therefore answers a different question from one calculated from volume. Looking at both inputs separately helps users describe what changed before assigning an interpretation to a summary measure.
Gamma exposure is also available through separate BTC, ETH and XAUT pages. Each GEX view shows modeled net exposure by strike, call and put walls, peak gamma and a gamma-flip reference. These views combine open interest, modeled gamma and spot sensitivity to help users inspect where the model places gamma concentration. The selected expiry, observation time and data units remain part of the reading. GEX estimates depend on assumptions about positions and hedging; they are not exchange-published dealer inventory. A change of sign or a wall level is a research reference and does not guarantee a price response.
The same attention to inputs applies to model-derived summary fields. Max pain and other calculated indicators are research references, and their usefulness depends on the observations and assumptions used. They do not establish a guaranteed future price, identify every participant’s purpose, or replace a reader’s own assessment of an options contract. The announcement concerns the availability of analytical tools rather than the performance of a trading strategy.
Feedback on the research workflow
JustTicks is inviting feedback on the crypto options pages, particularly the clarity of labels, expiry selection, time references and comparisons users want to make. Reports of an unclear or missing observation are more useful when they include the symbol, expiry and displayed timestamp. Those details allow the team to reproduce the selected view instead of comparing screens from different sessions or contracts.
The launch follows the platform’s publication of educational material explaining how to inspect option-chain information and put-call ratios. Product information and educational explanations are intended to help users understand the available research views. Readers should check current feature access on the platform and review the relevant venue’s contract specifications and access requirements when researching crypto derivatives.
The crypto tools include a BTC gamma-exposure page at BTC gamma exposure, with ETH and XAUT available in the symbol selector.
About JustTicks
JustTicks provides web-based analytics for stocks, futures and options, including option chains, open interest, put-call ratios, implied volatility, stock screeners, market breadth and institutional-flow data. Its crypto options tools extend the research interface to BTC, ETH and XAUT. The service supports independent market research. This announcement does not recommend an asset, options position or strategy, and makes no claim of guaranteed returns.